
See your practice clearly. Grow it confidently.
Bookings, revenue, no-shows and website visits — counted for you, in one dashboard, with exports your accountant can use.
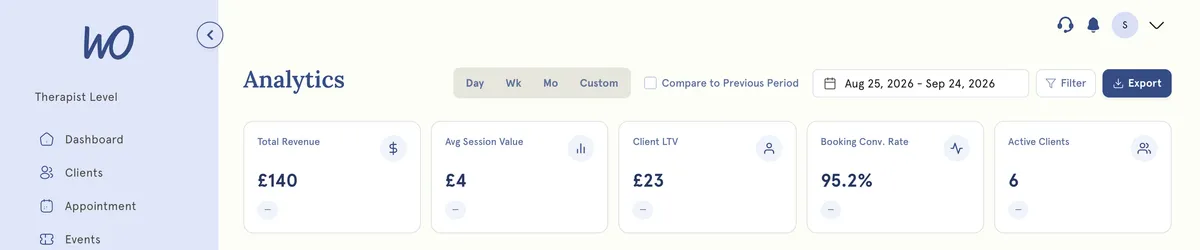
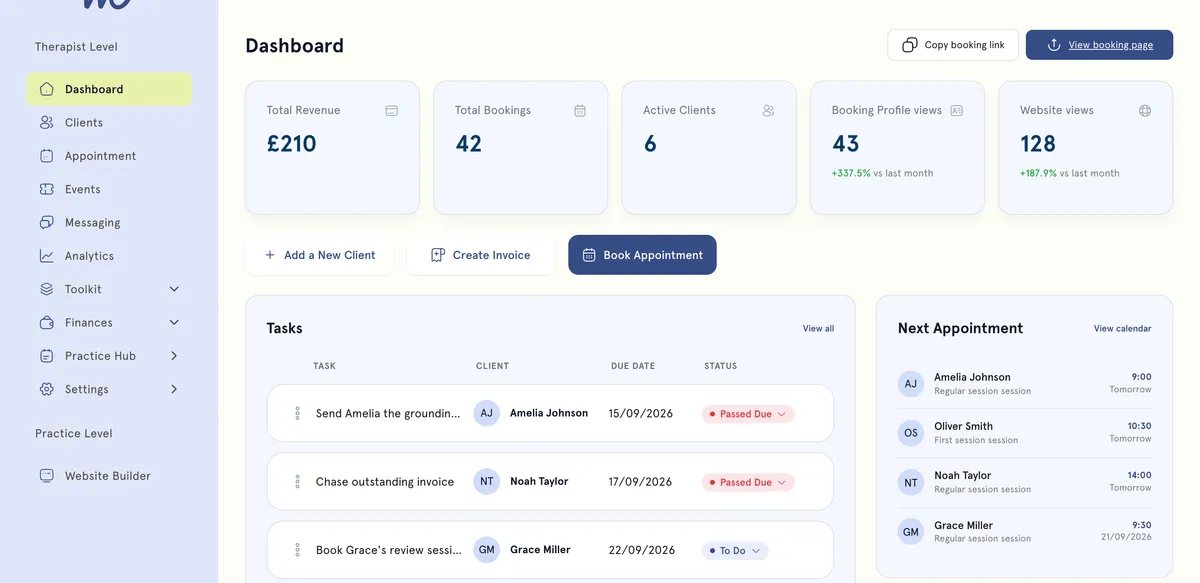
Today’s numbers, without opening a spreadsheet
Revenue, bookings, active clients and website views on one screen, with the change against last month. It's up to date each time you open it.
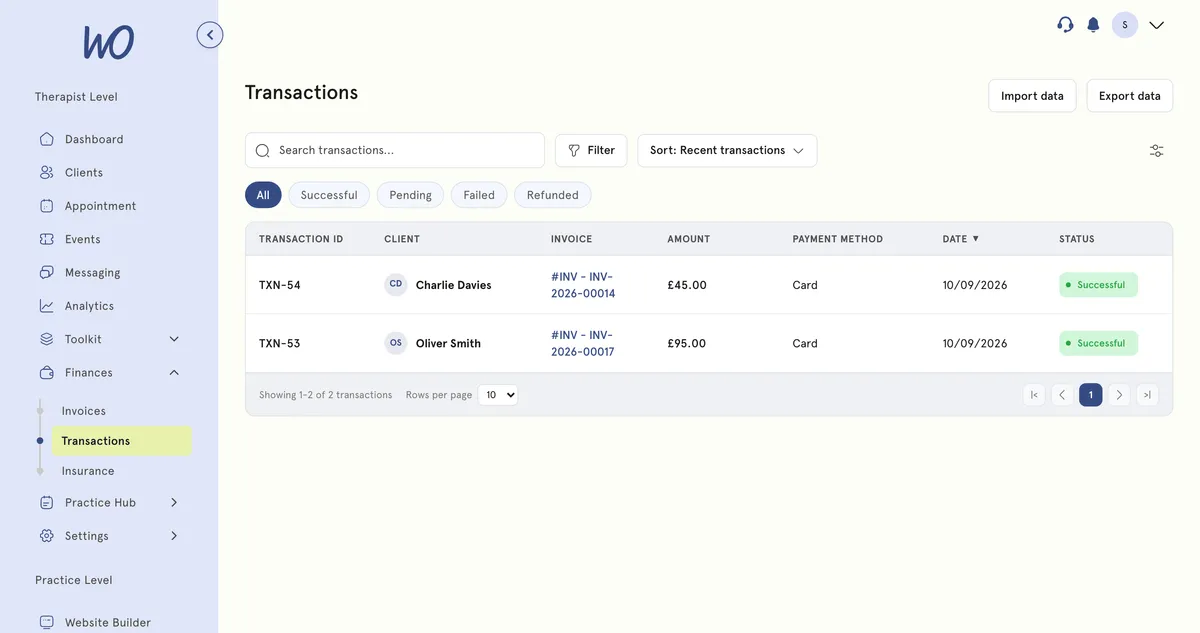
Paid, pending, refunded — filter it, export it
Every transaction tied to its invoice and client. Filter by status or search, then export — or let the accounting sync copy it into Xero, Sage, FreeAgent or Zoho Books as it happens.
See where your income comes from
Revenue is broken down by service, with bookings and average price for each — so pricing and scheduling decisions rest on numbers, not a hunch. Sort it below.
Spot the clients who haven’t been back
New versus returning, how often people come, and who's gone quiet. Reach out while it's still a nudge, not a win-back.
Workshop · last seen 2 May 146 days
Counselling · last seen 14 Jun 103 days
Couples therapy · last seen 28 Jul 59 days
Counselling · last seen 9 Aug 47 days
Initial consultation · last seen 19 Aug 37 days
How we help wellness professionals grow
Cut from admin a year — a full month of work back.
Saved a year by replacing booking, calendar and notes tools.
Saved on billing every month.
Of practitioners say setup is simple — no technical skills needed.
Numbers that appear on their own
No spreadsheet to keep up — the reports build themselves.
Every appointment and no-show counts itself.
Collected and outstanding — by service, by client, by month.
Views, booking-page visits and bookings, so you see where people drop off.
A dashboard for today, and transactions you can export for your accountant.
The counting, handled
Bookings, payments and website visits count themselves. You read the trend.
Real practitioners. Real results.
“The coaching session changed how I view my practice. I've increased my revenue by 30% while working fewer hours.”
Individual result. Outcomes vary by practice.Psychotherapist, UK
“Finally, a system that doesn't feel like it's designed for a hospital. It's clean, fast, and my clients love it.”
Counsellor, SA
“The GDPR compliance features take a huge weight off my shoulders. I can focus on my patients again.”
Clinical Psychologist
Frequently asked questions
Something else? Book a 20-minute demo.
Your dashboard shows revenue, bookings and clients at a glance. The Analytics page adds client retention, unpaid and overdue invoices, and session volume — up to date each time you open it.
Explore more of MyWellOps
One platform, so the next thing you need is already in it.
Launch a practice site in minutes→ Booking Widget
Take bookings on your existing site→ Smart Calendar
Scheduling without the back-and-forth→ Retreats & Events
Sell places on events, retreats and workshops→ Telehealth
See clients anywhere, instantly→ Notes
Write them yourself, find them fast→
Know the numbers. Grow the practice.
Start free. The dashboard fills as you work.
See it on the shape of your own practice
Book a short walkthrough and we'll set up your services, calendar and booking page with you — so you leave with a practice that already works.