
Before you start
- Analytics is included on the Growth and Professional plans. On other plans the page shows a blurred preview with Analytics is locked and an Unlock button to upgrade. See Change your plan or buy add-ons.
- Figures build up as clients visit your pages, book and pay. A new practice will see mostly zeros at first.
Steps
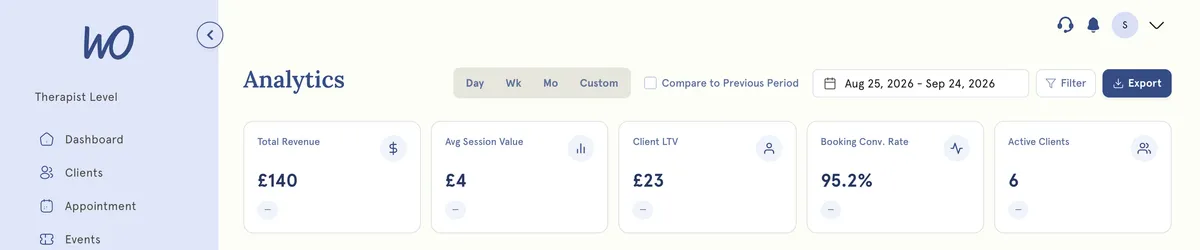
- In the sidebar, select Analytics. It opens on the last 30 days.
- Choose a date range:
- Day shows today.
- Wk shows the last 7 days and today.
- Mo shows the whole of last calendar month.
- For any other range, open the date picker and choose a start and end. You can’t pick dates after today.
- To see how the range compares with the one before, tick Compare to Previous Period. Each card then shows the change against the same number of days just before your range.
- Scroll down through the sections, explained below.
The five cards
- Total Revenue. Payments recorded as successful, by the date they were paid. That includes card payments and payments you record against invoices. Refunds aren’t taken off.
- Avg Session Value. Total Revenue divided by the number of completed sessions in the range.
- Client LTV. All the revenue you’ve taken up to the end of the range, divided by the number of clients who’ve had at least one completed session.
- Booking Conv. Rate. The number of appointments dated in the range that weren’t missed, as a percentage of views of your booking page in the range. It counts appointments however they were booked, not only online bookings.
- Active Clients. How many different clients had a completed session in the range.
The conversion funnel
The funnel shows each stage for your date range, with the percentage that carried on from the stage before.
- Website Views. Visits to your practice website pages.
- Booking Page Views. Visits to your booking page.
- Booking Started. Not measured yet, so it always shows 0.
- Booking Completed. Appointments dated in the range that weren’t missed.
- Returning Client. Clients from stage 4 who’d already had a completed session before the range started.
Your own visits while you’re signed in aren’t counted as views.
Revenue over time
The chart splits each day, week or month into two parts:
- Collected. Payments received in that period.
- Outstanding. Invoices issued in that period that are still unpaid or overdue.
Ranges up to 30 days show each day. Up to 90 days, each week. Longer ranges show each month.
Next to it, Revenue by Service lists your completed sessions by service, with Top Earning Service, Most Booked Service and Avg Revenue Per Visit. This uses the price of each completed session, not the payments received.
The other sections
- Client Insights. New and returning clients in the range. At-Risk Clients lists up to 20 clients whose last completed session was more than 30 days ago and who have nothing booked. Top Clients by Spend ranks clients by payments in the range.
- Website & Booking Traffic. Website views, booking page views and completed bookings over time, with a click-through rate.
- Bookings & Scheduling. No-Show Rate, Avg Lead Time (how far ahead sessions are booked), Peak Days and Peak Hours. Cancellation Rate and Avg Cancellation Notice aren’t calculated yet and show N/A.
- Revenue Leakage. Unpaid Invoices, Overdue Invoices and Avg Days to Pay.
- Capacity & Efficiency. Utilisation Rate, Revenue Per Available Hour, Avg Sessions Per Week and Travel Time (from buffers), worked out from your availability, sessions and travel buffers.
Good to know
- A session counts as completed when it’s ended in a MyWellOps video call. Sessions held another way, such as in person, aren’t marked completed. They’re marked as missed about an hour after they end. That affects every figure based on completed sessions, and No-Show Rate.
- The figures are worked out when the page loads, so refresh to see the latest.
- The Filter and Export buttons don’t do anything yet.
- For running totals since you started, see Understand your dashboard.
Troubleshooting
Everything shows 0 or —. Check the date range. If you’re new, figures appear as clients visit your booking page, book and pay. Change figures only appear with Compare to Previous Period ticked, and show — when the previous period had nothing to compare with.
I see “Unable to load analytics. Please try again later.” Refresh the page. If your plan changed recently, check it includes Analytics.
Active Clients or Avg Session Value look too low. They only count completed sessions, and only sessions ended in a MyWellOps video call are marked completed.
Booking Started always shows 0. It isn’t measured yet.